Promotional merchandise is one of the most tactile forms of marketing available to Australian businesses. A branded tote bag or quality pen doesn’t disappear in a spam folder or make a fleeting impression. It sits on a desk, travels on a commute, and puts your brand in front of people every single day. But here is the problem most marketers face: after the event ends and the boxes are unpacked, the question becomes – did it actually work?
Measuring promotional merchandise campaigns requires a different mindset than measuring digital advertising. There are no click-through rates or pixel events. The data is more human. However, the right framework makes measurement straightforward and repeatable. This guide covers exactly how to do it – from setting goals before you spend a dollar, to calculating ROI after the item is distributed.
Why Measuring Promotional Merchandise ROI Matters
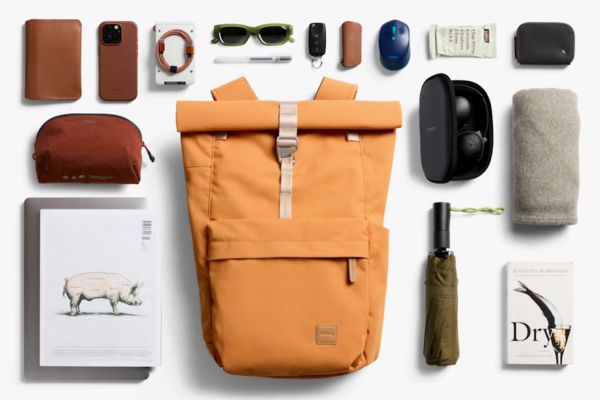
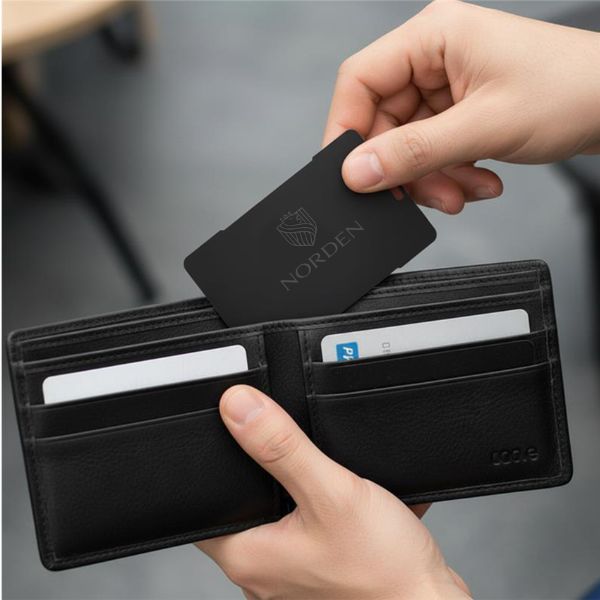
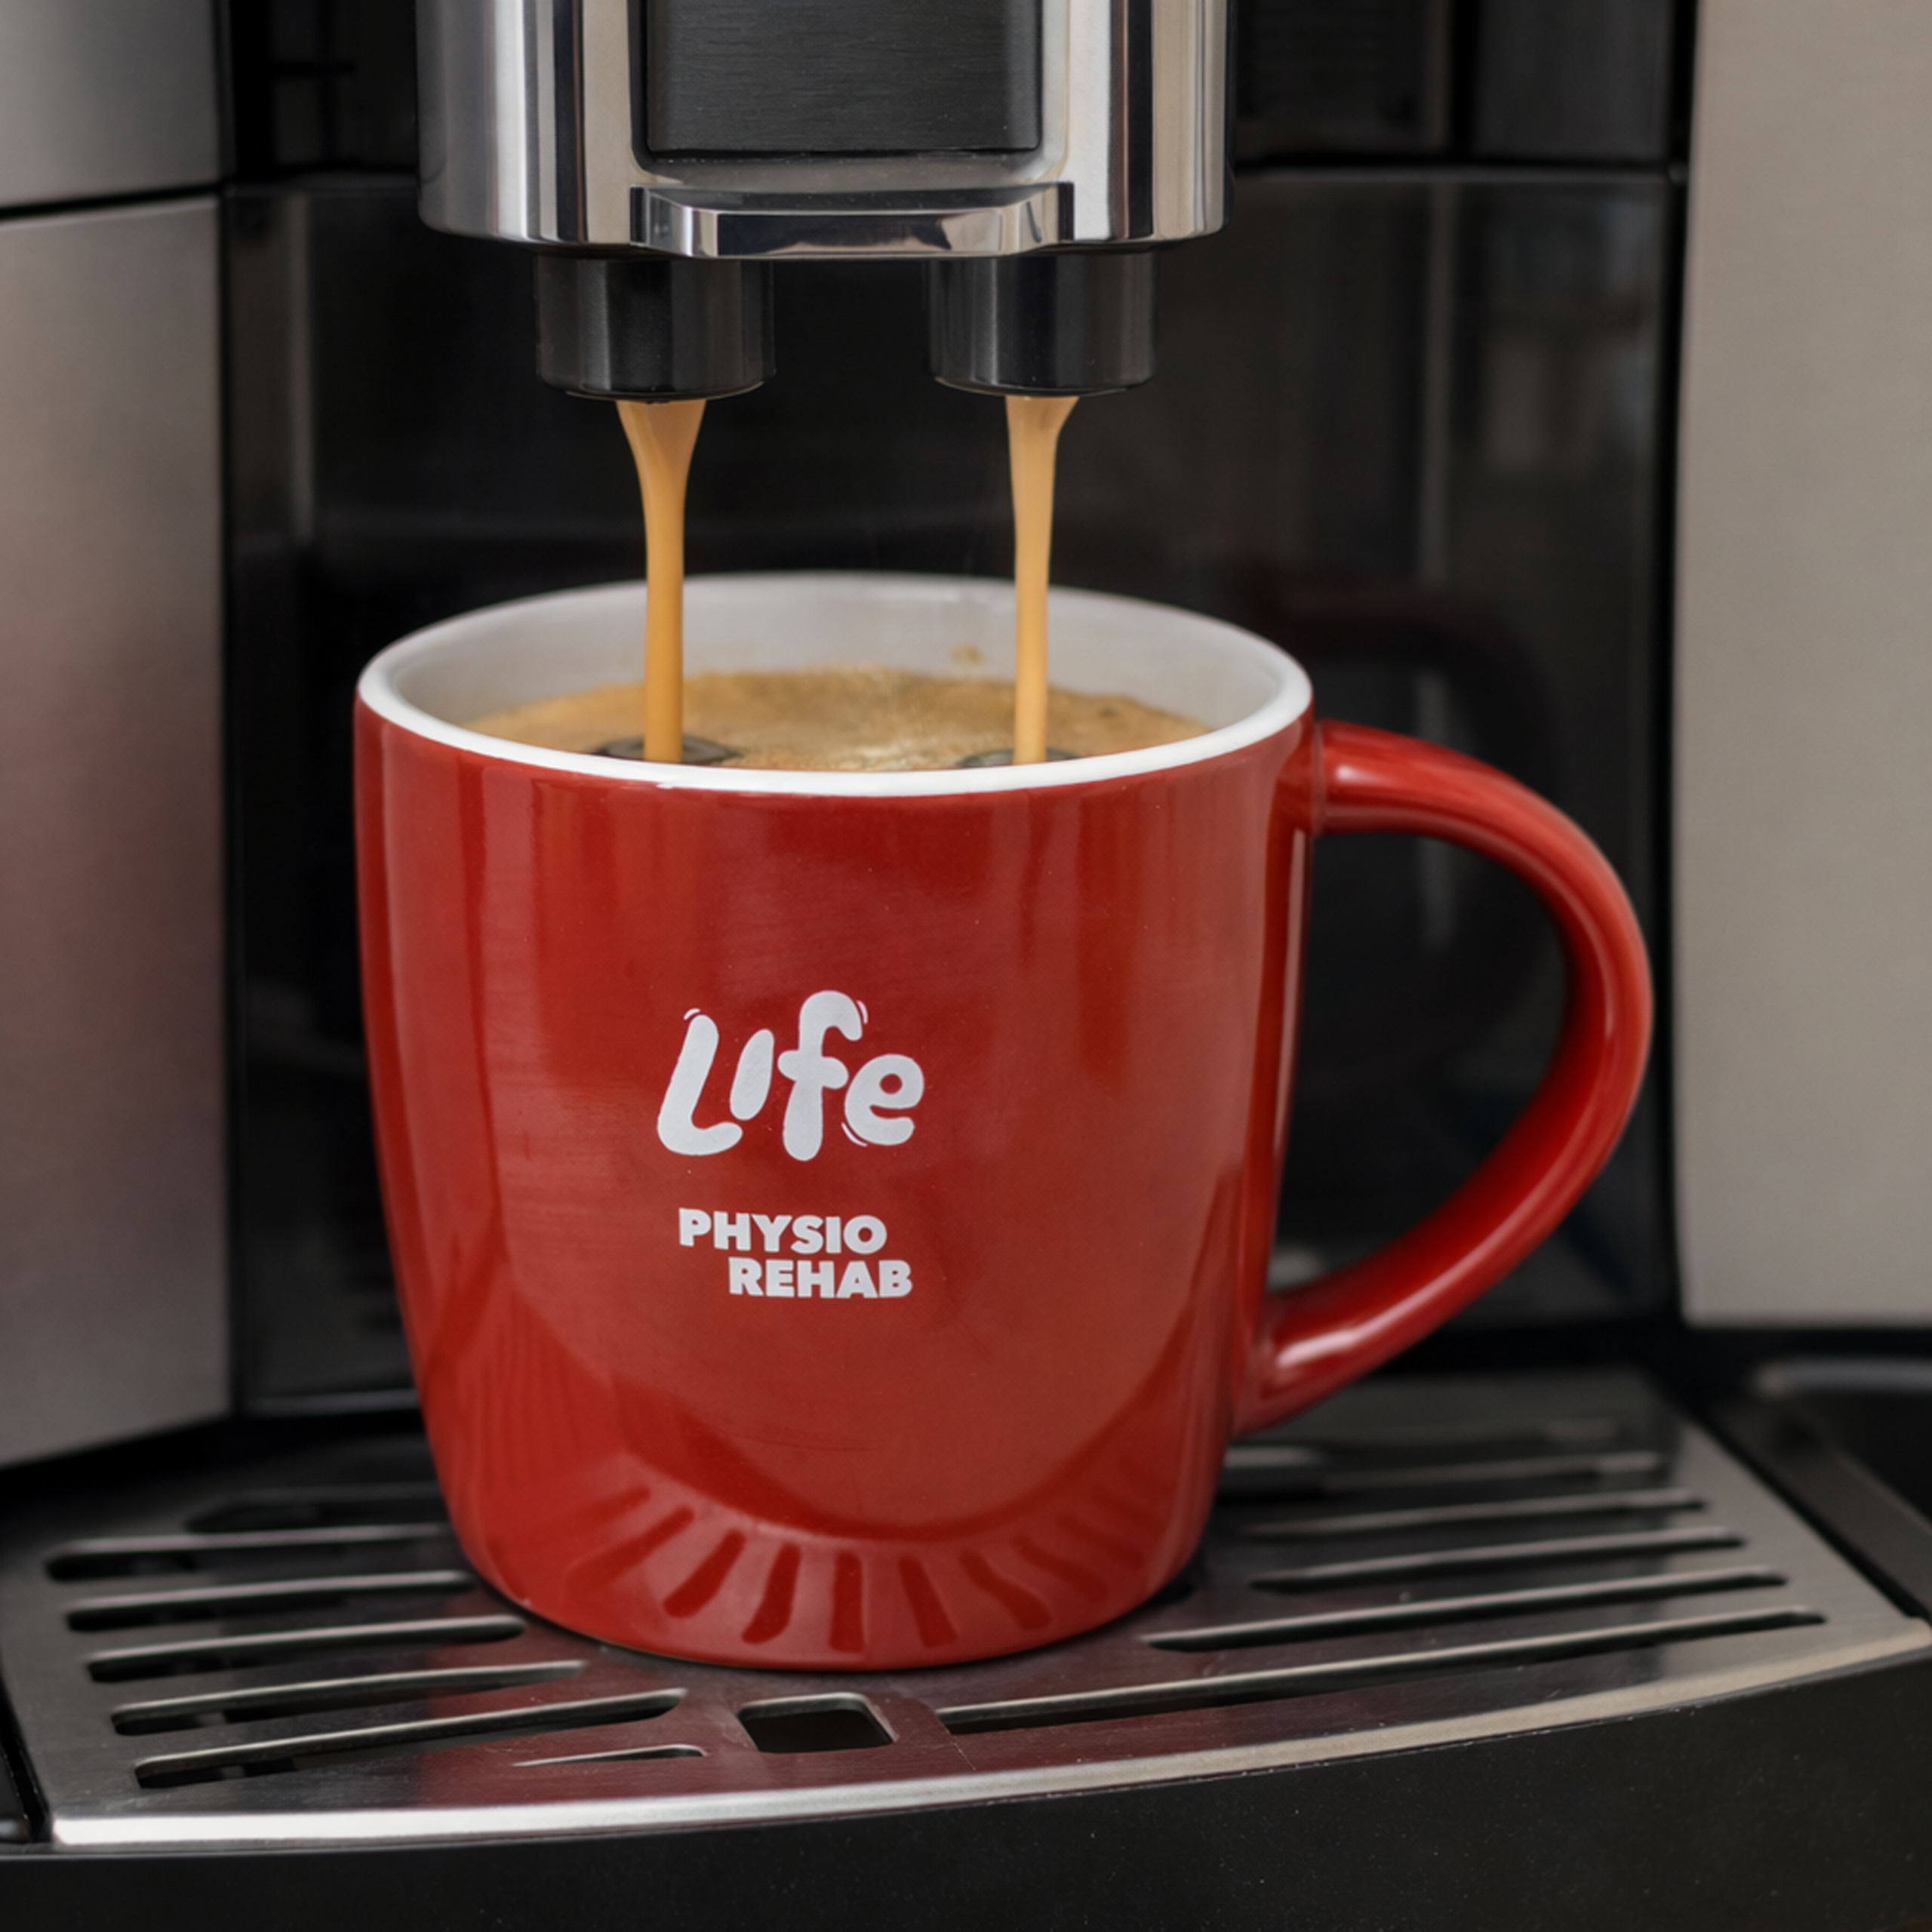
Promotional products (also called branded merchandise, giveaways or swag) are used as cost-effective marketing tools to heighten awareness of different brands and products. Some of the most popular promotional products include pens, mugs, t-shirts, drink bottles, lanyards and caps.
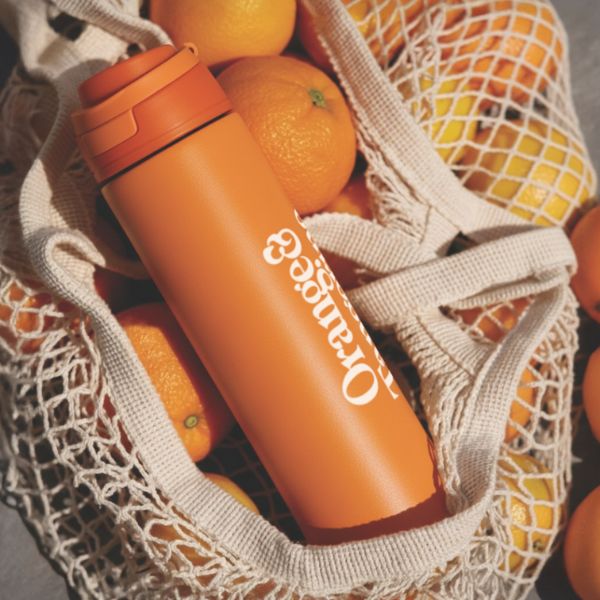
Without measurement, merch budgets become easy targets during budget reviews. However, when you can demonstrate that a $3,000 investment in branded water bottles generated 45,000 brand impressions and contributed to 12 qualified leads, your next campaign gets approved faster.
The business case is clear: the PPAI (Promotional Products Association International) found that 85% of people who receive promotional items remember the brand that gave them the item. That recall only translates to business value if you measure and act on it.
Step 1: Define Your Campaign Goals Before You Order
Measurement starts before the merchandise even arrives. Every successful campaign ties its merch strategy to a specific business objective.
Common goals for promotional merchandise campaigns include:
- Increasing brand awareness at trade shows or community events
- Generating leads at conferences or activations
- Rewarding and retaining existing customers or employees
- Onboarding new staff and reinforcing company culture
- Supporting a product launch or seasonal promotion
Each goal requires a different success metric. Therefore, the goal you set determines the KPIs you track.
| Example: If your goal is lead generation at a tradeshow, your primary metric is the number of qualified conversations or scanned badges tied to your merch giveaway. If your goal is brand awareness, your metric is estimated impressions and post-event recall surveys. |
Step 2: Establish Your Baseline Before Launch
A baseline is your starting point. Without one, you cannot prove your campaign moved the needle.
Capture these data points before distributing your merchandise:
- Brand awareness levels: use a short pre-event survey asking if respondents recognise your brand
- Website traffic from your target audience segment (use UTM parameters or audience filters in GA4)
- Current lead volume or conversion rate from the event or channel you are targeting
- Net Promoter Score (NPS) or customer satisfaction data if running a retention campaign
Collecting baseline data takes less than a day. Skipping it makes post-campaign reporting guesswork. Because you cannot measure lift without a starting point, this step is non-negotiable.
Step 3: Track the Right Metrics for Your Campaign Type
Different campaign types require different measurement approaches. Use the table below to match your objective to the right KPIs.
| Metric | What It Measures | Where to Find It |
| Brand recall rate | % of recipients who remember your brand after receiving merch | Post-event survey (email or QR-linked form) |
| Cost per impression (CPI) | Total merch spend ÷ estimated total impressions | PPAI impression data + item quantity |
| Engagement rate | % of recipients who took a desired action after receiving the item | QR code scans, promo code uses, landing page visits |
| Lead attribution rate | # of leads who interacted with your merch before converting | CRM tagging + post-event follow-up data |
| Customer retention lift | Change in repeat purchase rate or NPS among merch recipients vs non-recipients | CRM segment comparison over 90–180 days |
| Social share rate | # of organic social posts featuring your branded item | Hashtag monitoring, brand mentions, UGC tracking |
How to Calculate Cost Per Impression for Merch
Cost per impression (CPI) is the most comparable metric to digital advertising benchmarks. It allows you to put a like-for-like number on your investment.
The formula is:
| Formula: CPI = Total campaign spend ÷ Total estimated impressions Example: $2,500 spent on 500 branded tote bags × 6,100 average lifetime impressions per bag (PPAI data) = 3,050,000 total impressions. CPI = $2,500 ÷ 3,050,000 = $0.0008 per impression. |
For context, a Facebook display ad in Australia averages $0.50–$2.50 per thousand impressions (CPM). A quality promotional item regularly delivers impressions at a fraction of that cost and those impressions happen in real-world settings where attention is not being competed for.
Step 4: Use QR Codes and UTM Links to Track Engagement
The biggest challenge with physical merchandise is bridging the offline-to-online gap. QR codes and unique landing pages solve this directly.
Here is how to use them effectively:
- Create a unique landing page or URL for each campaign for example, promotionproducts.com.au/event-name-2026
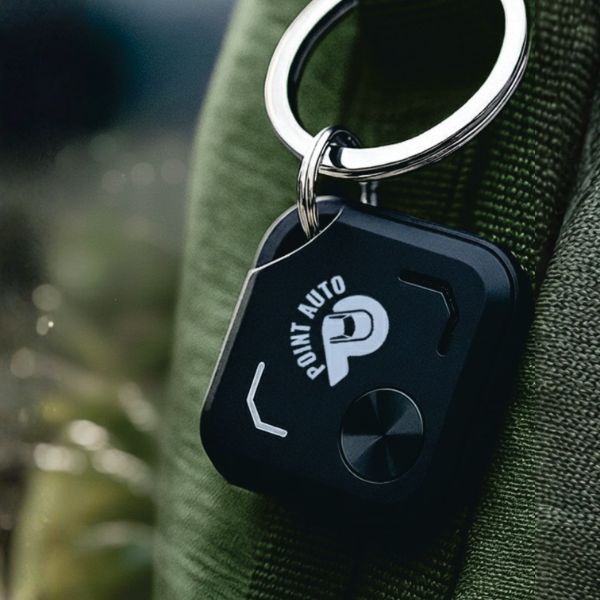
- Embed a QR code on the merchandise itself, the packaging, or an attached tag card
- Use UTM parameters on all URLs so Google Analytics 4 attributes visits to the correct campaign
- Add a promo code unique to the campaign so purchases or sign-ups can be directly attributed
- Set up a goal or conversion event in GA4 for landing page visits, form fills, or purchases
This approach gives you real, trackable data from a physical item. A campaign distributing 400 branded notebooks with a QR-linked resource offer, for example, can generate measurable website traffic, email sign-ups, and download conversions.

Step 5: Conduct Post-Campaign Surveys for Brand Recall
Surveys remain the gold standard for measuring brand awareness and recall. They take two weeks to run and cost almost nothing.
When to Survey
Send your survey 7–14 days after the event or campaign distribution. This time frame captures short-term recall before it fades, while allowing recipients time to interact with the promotional product.
What to Ask
Keep surveys to 5 questions or fewer. Longer surveys reduce completion rates. Include these core questions:
- Can you name the brand that gave you [item type] at [event name]?
- How often do you use or see this item in a week?
- Has this item changed your perception of the brand? (Scale: 1–5)
- Have you visited the brand’s website or made a purchase since receiving the item?
- Would you recommend this brand based on your experience?
Distribute surveys via email, SMS, or a QR code card included with the merchandise. A 15–25% response rate is a reasonable benchmark for B2B campaigns.
Step 6: Tag and Track Merch Recipients in Your CRM
CRM tagging is underused in promotional merchandise measurement. It is one of the most powerful tools for attributing long-term value to your campaign.
When distributing merch at an event or through a direct send, tag every recipient in your CRM with:
- The campaign name and date
- The item type received
- The event or distribution channel
After 90 and 180 days, run a segment comparison. Compare the conversion rate, average order value, and retention rate of merch recipients versus a comparable control group who did not receive an item.
This approach provides concrete evidence of downstream revenue influence, the data that makes the strongest business case in a budget review.

What Good Looks Like: Benchmarks for Merch Campaigns
Use these industry benchmarks to calibrate your results. Benchmarks vary by item type, audience, and distribution method.
| Benchmark | Typical Range |
| Brand recall rate | 78–90% at 6 months (quality items) |
| Cost per impression (wearables) | $0.0005–$0.002 per impression |
| QR code scan rate (event merchandise) | 8–18% of distributed items |
| Post-event survey response rate (B2B) | 15–25% |
| CRM-attritbuted conversion lift | 12–30% higher vs non-recipients |
| Average item lifespan (high-quality branded) | 6–24 months |

How Promotion Products Helps You Choose Merch That Performs
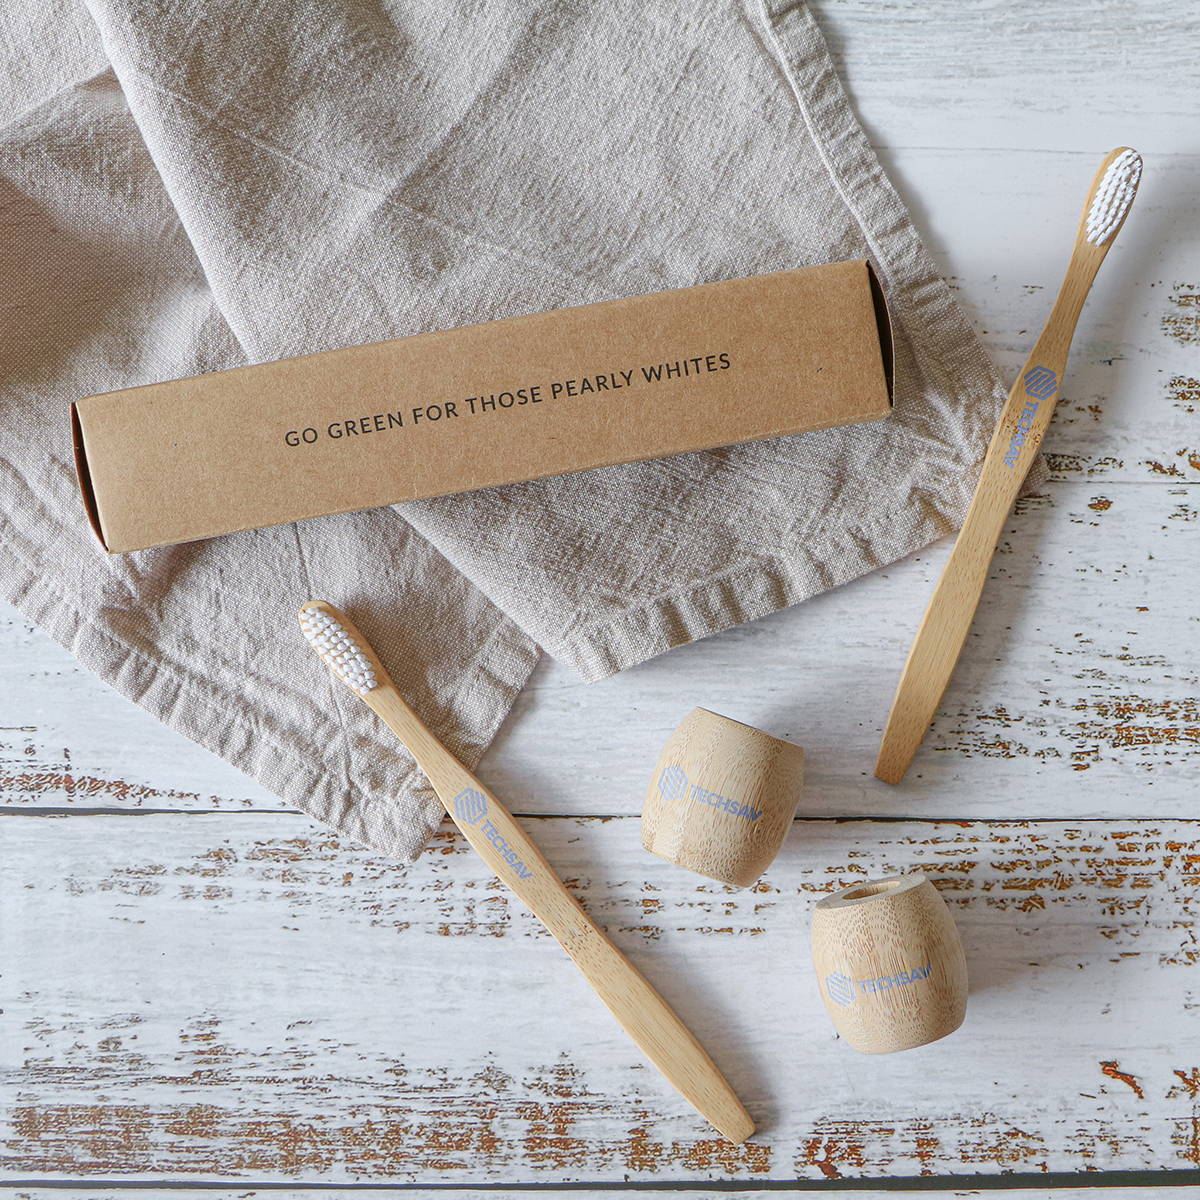
The items most likely to generate strong recall and extended impressions are items people actually use. Quality matters here, a cheaply made pen that breaks after a week does not generate as many impressions as a quality one.
At Promotion Products, we help Australian businesses choose merchandise that matches their campaign goals, audience, and budget. Because we understand how measurement works, we can advise on items that optimise impression value and engagement rates.
Whether you are planning a trade show giveaway, a client appreciation gift, or a staff onboarding kit, we can guide you toward items with proven performance. Explore our full range of promotional products or speak to our team about building a measurable campaign.
Frequently Asked Questions
Marketing Coordinator at Promotion Products. Eve holds a Bachelor’s Degree in Business and Marketing. She combines creativity and strategy to help brands make a lasting impression through thoughtful merchandise. Passionate about creating community through merch, storytelling and design, Eve oversees everything from campaign planning to content creation – championing merchandise as the powerful marketing medium it is.